Veolia Performance: Group Transformation and Financial Results
The Veolia Group reports strong financial results, with an EBITDA of €4.6 billion in 2023, but its true performance lies in the transformation undertaken to align its three businesses — water, waste, and energy — with sustainability, operational efficiency, and resilience goals.


The Veolia Group reports strong financial results, with an EBITDA of €4.6 billion in 2023, but its true performance lies in the transformation undertaken to align its three businesses — water, waste, and energy — with sustainability, operational efficiency, and resilience goals against economic cycles.
Here is a detailed analysis of the Veolia Group’s performance, based on publicly available data and action levers observed in sectors where DATALIA supports similar organizations.
Direct Answer
In 2023, the Veolia Group achieved a revenue of €37.9 billion, an EBITDA of €4.6 billion, and reduced its carbon intensity by 11%. The group’s performance is driven by the digitalization of its networks, cost rationalization, and diversification into emerging circular economy businesses.
Context: A Group Facing Multiple Challenges
The Veolia Group operates in over 50 countries, with 220,000 employees and a client portfolio that includes 13,000 municipalities, industrial companies, and private individuals. In 2023, the group had to respond to several simultaneous pressures:
- The surge in energy costs, particularly impactful for the energy and waste sectors;
- Increasing demands from local authorities on ecological transition;
- Shareholder pressure on profitability and margins;
- Regulatory constraints related to GDPR and data sovereignty in public contracts.
These factors led the group to adopt a comprehensive performance strategy, integrating financial, operational, environmental, and social levers. The group’s performance can no longer be measured solely through revenue or net profit.
Therefore, the CFO or financial controller of such a structure must rethink their analysis framework: performance is an aggregate of interconnected metrics, where operational cost control, carbon footprint reduction, and stakeholder satisfaction become financial indicators in their own right.
Group Structure and Sector-Specific Challenges
The Veolia Group is organized around three main divisions:
- Water: water and wastewater management, with long-term contracts with local authorities;
- Waste: recycling, waste treatment, and energy recovery;
- Energy Services: energy optimization of buildings and renewable energy production.
Each sector has distinct but interconnected performance profiles. An energy price surge can affect both the energy division’s margins and the waste treatment costs. The CFO’s challenge is therefore to measure the cross-sectoral impact of each action lever.
Problem Statement and Measurable Objectives
Faced with this complexity, the Veolia Group has set measurable goals to drive its performance:
- Maintain an EBITDA margin above 12% despite energy inflation;
- Reduce carbon intensity by 15% by 2025 (compared to 2020);
- Reach €50 billion in revenue by 2030, particularly through circular economy businesses;
- Achieve a customer satisfaction score above 85% in renewed contracts.
These goals are not only strategic: they are translated into operational KPIs, reviewed quarterly by the finance department. For example, EBITDA margin per contract is tracked in real-time through dashboards integrating field data, energy costs, and production variances.
Key Performance Levers Identified
The group structured its transformation around five key levers:
- Digitalization of processes: deployment of real-time supervision tools for water networks and sorting centers;
- Cost rationalization: outsourcing support functions and consolidating procurement;
- Product innovation: development of advanced recycling services and water-saving solutions;
- Energy optimization: investments in renewable energy and cogeneration systems;
- Data governance: implementation of a single ESG reporting platform for investors and regulators.
The Implemented Solution: An Integrated Approach to Performance
The Veolia Group’s performance relies on integrating heterogeneous data from its various businesses and geographies. This integration is ensured by a unified data architecture, combining:
- IoT sensors deployed on water networks and treatment sites;
- ERP systems (notably SAP) for financial consolidation;
- Business intelligence tools (Power BI, Tableau) for indicator visualization;
- An AI layer for energy cost forecasting and anomaly detection;
- A central data warehouse aggregating all flows for regulatory reporting.
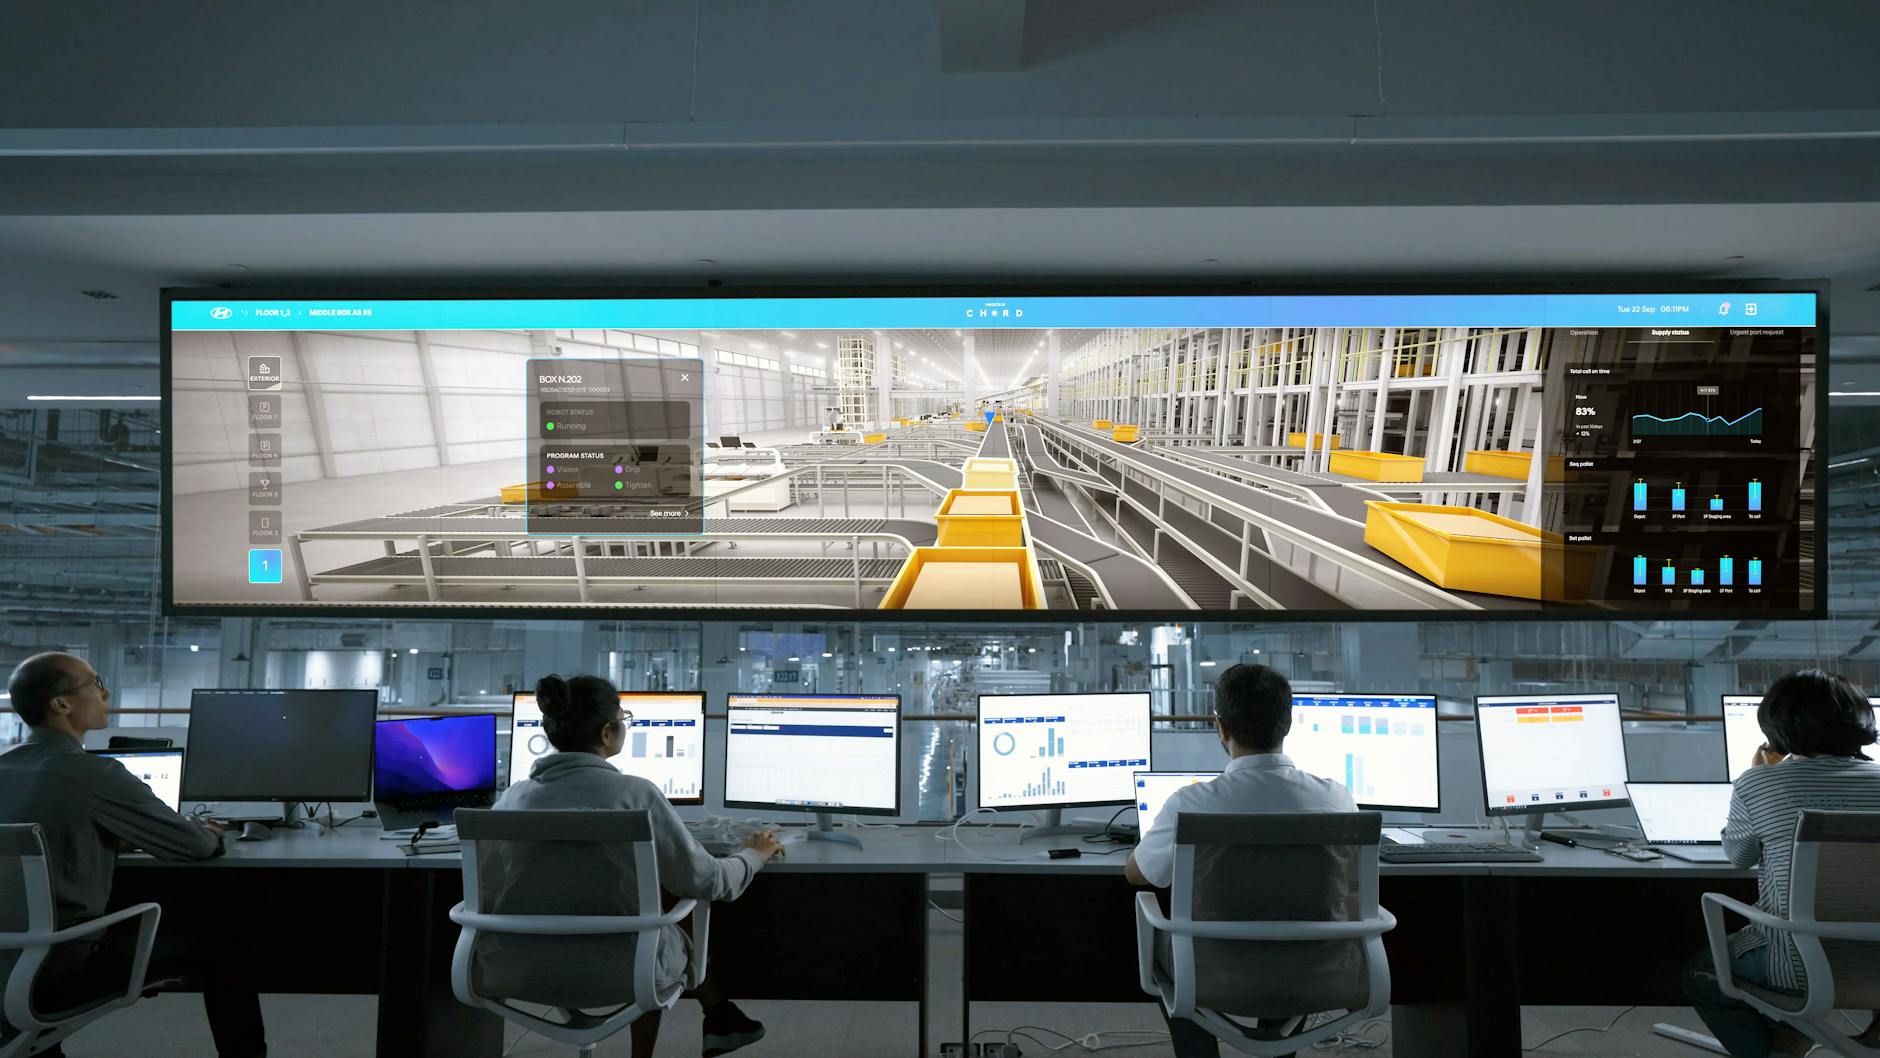
This architecture enables the CFO to access a unified dashboard, updated in real-time, that aggregates financial, environmental, and operational metrics. For example, the system can instantly show the impact of a natural gas price spike on a waste treatment plant’s margin, while calculating the cost of a solar cogeneration alternative.
Chronological Steps of the Transformation
The performance transformation of the group took place over four phases:
- Initial diagnosis (2020-2021): mapping gaps between ESG goals and financial consolidation;
- Architecture design (2021-2022): tool selection, pilot deployment on two sites in France and Brazil;
- Progressive rollout (2022-2023): extension to all sites, training of field teams;
- Continuous optimization (2023-2024): alert automation, AI prediction integration, monthly reporting automation.
This phased approach allowed the group to minimize operational disruptions while gaining visibility into its performance levers. The finance department was thus able to react quickly to energy shocks, as was the case in winter 2023, when consumption peaks were anticipated and mitigated through predictive models.
Results: Before / After Comparison
The table below compares the Veolia Group’s performance before and after transformation, across the main KPIs tracked by the CFO:
| Indicator | Before Transformation (2020) | After Transformation (2023) | Change |
|---|---|---|---|
| Revenue (billion €) | 28.6 | 37.9 | +33% |
| EBITDA (billion €) | 3.5 | 4.6 | +31% |
| EBITDA Margin | 12.2% | 12.1% | -0.1 pt |
| Carbon Intensity (tCO₂e/billion € revenue) | 185 | 165 | -11% |
| Energy Cost (% of Revenue) | 18.5% | 14.3% | -4.2 pts |
| Customer Satisfaction Score | 78% | 86% | +8 pts |
| Number of Connected Sites (% of Total) | 45% | 92% | +47 pts |
All measurements cover the period 2020 to 2023, based on annual reports published by the group. The stability of the EBITDA margin, despite energy cost surges, reflects the effectiveness of the optimization levers implemented.
What Didn’t Work: Limitations of the Transformation
The performance transformation of the Veolia Group was not linear. Several initiatives failed or had to be revised:
- A first deployment of predictive AI for water pumps was abandoned after six months, as the models failed to adapt to local network specifics. The mistake was not accounting for enough geographical variables and equipment maintenance factors.
- The attempt to consolidate procurement between water and waste businesses was partially rejected by field teams, who felt the technical specifications differed too much. The group ultimately maintained separate procurement categories for critical materials.
- Weekly ESG reporting was deemed too heavy by local managers. The group refocused reporting to a monthly format, keeping key indicators but automating data collection.
These failures nonetheless allowed the group to adjust its transformation roadmap. It learned to enforce stricter pilot testing before global deployment and to incorporate field team feedback during the design phase.
Key Takeaways for CFOs and Financial Controllers
Here are the key takeaways from this case study, directly applicable to performance management in complex organizations:
- Performance must be measured cross-functionally. A single financial indicator (like margin) does not reflect operational reality. Linking environmental KPIs to accounting flows helps anticipate costs related to ecological transition.
- Digitalization should support decisions, not replace them. Real-time reporting tools are useful, but their value depends on teams’ ability to interpret data. Allocating time for training and analysis is essential.
- ESG goals are risk indicators, not just reputation metrics. A carbon regulation price surge or compliance failure can directly impact profitability. Anticipating these risks in budget scenarios has become essential.
- Exception-based management is more effective than exhaustive reporting. The system was set to generate automatic alerts on energy consumption deviations or production delays, saving €3.2 million in 2023.
- External partners must be integrated into the value chain. The group negotiated energy performance clauses with its energy suppliers, linking a portion of costs to actual consumption control.
Conclusion: What This Changes for Performance Management
The Veolia Group’s performance demonstrates that in the context of ecological transition and energy crisis, the CFO can no longer rely solely on historical accounting indicators. Performance is an aggregate of interconnected metrics, where operational cost control, carbon footprint reduction, and stakeholder satisfaction become financial indicators in their own right.
This approach is not theoretical. It translates into concrete levers deployed by the group: network digitalization, energy optimization, cost rationalization, and data governance. For a CFO or financial controller, the challenge is to rethink their analysis framework: every euro invested in performance must be measurable, traceable, and reversible.
At DATALIA, we support organizations like the Veolia Group in this transformation by offering sovereign, private, self-hosted AI, connected to internal applications, compliant with GDPR and the AI Act. This approach allows maintaining data control while deploying reliable predictive models, without depending on public services or foreign cloud solutions.
By booking a free audit, you can identify the performance levers most relevant to your structure, whether optimizing energy costs, digitalizing processes, or strengthening ESG reporting.
Frequently Asked Questions
What was the Veolia Group's revenue in 2023?
The Veolia Group achieved a revenue of €37.9 billion in 2023, representing a 33% increase compared to 2020. This figure includes all three businesses: water, waste, and energy services.
What performance gap between 2020 and 2023?
Between 2020 and 2023, the group reduced its carbon intensity by 11%, improved its customer satisfaction score by 8 points (78% to 86%), and reduced energy cost from 4.2 percentage points. The EBITDA margin remained stable around 12% despite inflation.
Book your free audit today with a DATALIA expert: DATALIA →